ECOLEAF: U.S. Electricity Production

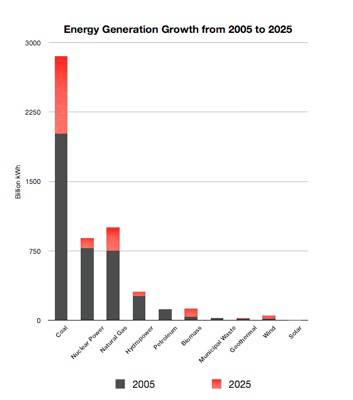
The reason coal is used more frequently than other forms of energy is because it is the cheapest material for producing electricity. The decline of petroleum installations has been primarily due to increases in fuel costs: the more expensive the source, the less often it is utilized.
US electricity consumption in 2005: 3,816 million MWh
US Coal Capacity Usage in 2006: 72.6% of 312,956 MW
US Natural Gas Powered electricity consumption in 2005: 758 million MWh
US Natural Gas Capacity Usage in 2006: 38.3% of 388,294 MW
US Nuclear Powered electricity consumption in 2005: 782 million MWh
US Nuclear Capacity Usage in 2006: 89.6% of 100,334 MW
US Hydroelectric Powered electricity consumption in 2005: 270 million MWh
US Hydroelectric Capacity Usage in 2006: 42.4% of 77,821 MW
US Petroleum Powered electricity consumption in 2005: 64 million MWh
US Petroleum Capacity Usage in 2006: 12.6% of 58,097 MW
US Wind Powered electricity consumption in 2005: 18 million MWh
US Wind Powered Capacity Usage in 2006: 24% of 11,351 MW
Electricity is distributed three ways; prices vary by customer type. Residential consumers pay more than commercial consumers, and industrial consumers pay the least. As a breakdown of overall use, residential consumers represented 35.6% of the total energy used in 2005. Commercial consumers used 33.4% and industrial used 26.7%.
Residential Use in 2005: 1,359 million MWh (35.6%)
Residential Customers in 2005: 120,761
Residential Average Retail Price in 2005: 9.45 cents per kWh (5.6% increase from 2004)
Residential Average Retail Price in 2006: 10.40 cents per kWh (10.1% increase from 2005)
Commercial Use in 2005: 1,275 million MWh (33.4%)
Commercial Customers in 2005: 16,872
Commercial Average Retail Price in 2005: 8.67 cents per kWh (6.1% increase from 2004)
Commercial Average Retail Price in 2006: 9.46 cents per kWh (9.1% increase from 2005)
Industrial Use in 2005: 1,019 million MWh (26.7%)
Industrial Customers in 2005: 734
Industrial Average Retail Price in 2005: 5.25 cents per kWh (9.1% increase from 2004)
Industrial Average Retail Price in 2006: 6.16 cents per kWh (7.5% increase from 2005)
An important aspect of energy use is the retail cost of energy. The higher the price becomes for traditional energy, the more viable green energy solutions become. This could partially explain why new investments are being made in alternative energy sources: if retail energy costs keep increasing, green energy will have an easier time entering the marketplace. The more the percentage-cost-per-kWh increases, the more competitive (and therefore viable) green energy becomes.
UNDERSTANDING THE U.S. LAND AND CARBON FOOTPRINT
In 2005, the U.S. produced 22% of the world’s carbon emissions despite the fact that it represented only 4% of the global population and about 6.5% of the world’s land area. In 2009, China overtook the U.S. in carbon emissions; China is anticipated to out-produce the U.S. by 15% in 2010.
In 2005, each American produced an average 20.1 metric tons of carbon dioxide. In comparison, China produced 4.1 metric tons per person. If China reaches the level of per-capita dioxide pollution that the U.S. has reached, the amount of global carbon emissions will increase by 20,896 million metric tons. This would mean a staggering increase of 77% in global carbon emissions.
China is ranked forth in the world in terms of land mass; Russia, Canada, and the U.S. rank higher. If Europe and its 46 countries were combined, they would be bigger than the U.S. and would rank as the world’s third-largest country.
BREAKOUT OF LAND AND CARBON FOOTPRINTS:
United States
5,597 Million Metric Tons of Carbon Dioxide (22.0% of the world in 2004)
6,011 Million Metric Tons of Carbon Dioxide (Est. in 2010)
9.63 Billion sq kilometers of Land Mass
295.7 Million People
China
4,753 Million Metric Tons of Carbon Dioxide (17.6% of the world in 2004)
6,898 Million Metric Tons of Carbon Dioxide (Est. in 2010)
9.6 Billion sq kilometers of Land Mass
1.306 Million People
Europe
4,373 Million Metric Tons of Carbon Dioxide (16.2% of the world in 2004)
4,512 Million Metric Tons of Carbon Dioxide (Est. in 2010)
9.94 Billion sq kilometers of Land Mass
727 Million People
Russia
1,669 Million Metric Tons of Carbon Dioxide (6.2% of the world in 2004)
1,789 Million Metric Tons of Carbon Dioxide (Est. in 2010)
17.075 Billion Sq Kms of Land Mass
143.4 Million People
Canada
623 Million Metric Tons of Carbon Dioxide (2.3% of the world in 2004)
669 Million Metric Tons of Carbon Dioxide (Est. in 2010)
9.98 Billion sq kilometers of Land Mass
32.8 Million People
U.S. ELECTRICITY PRODUCTION


Stay Informed
Get updates and action alerts.


back
next

Delivering Green Clarity in a Carbon-Troubled World™
Copyright © 2008 - 2010 by ECOLEAF™. All rights reserved.
Reproduction in whole or in part without permission is prohibited.